### Learning objectives (15' class) By the end of this lesson, students are expected to be able to: * Recognize that they can use `ggplot2::ggplot()` and `plot()` to make graphics in R. * Understand that there are multiple valid syntaxes in R (tidyverse, base R) --- ### Students should know in advance * Basics of R programming * RStudio IDE * RMarkdown * R packages * Tidyverse --- background-image: url(images/cuadrados.png) background-size: cover class: bottom .bg-washed-green.b--dark-green.ba.bw2.br3.shadow-5.ph4.mt5[ ## Data Visualization I #### Lesson 1: Orientation to statistical graphics ] --- ## Data Science <img src="images/data.png" width="650" style="display: block; margin: auto;" /> .footnote[Adapted from [R for Data Science](https://r4ds.had.co.nz/explore-intro.html)] --- ## Data Science <img src="images/data2.png" width="650" style="display: block; margin: auto;" /> .footnote[Adapted from [R for Data Science](https://r4ds.had.co.nz/explore-intro.html)] --- class: center, middle .pull-left[ <!-- --> ] .pull-right[ <!-- --> ] --- .pull-left[ <!-- --> ] .pull-right[ 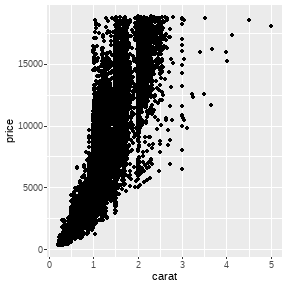<!-- --> ] #### Which one of these statements is true? -- **A.** These plots were made using different programming languages. -- **B.** Both plots were made using R. -- **C.** None of the above. --- .pull-left[ 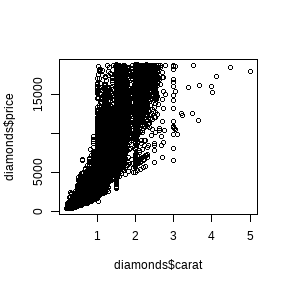<!-- --> ] .pull-right[ 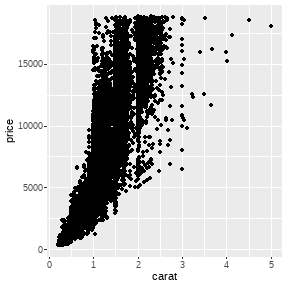<!-- --> ] #### Which one of these statements is true? **A.** These plots were made using different programming languages. <span style="background-color: lightblue">**B.** Both plots were made using R.</mark> **C.** None of the above. --- .pull-left[ 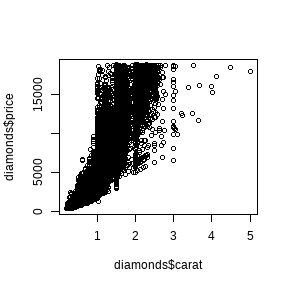<!-- --> ####`plot()` ] .pull-right[ 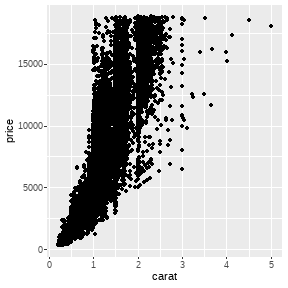<!-- --> ####`ggplot2::ggplot()` ] #### <pre class="tab">base R tidyverse</pre> --- class: middle, center .pull-left[ <img src="images/hex.png" width="250" style="display: block; margin: auto;" /> ] .pull-right[ <!-- --> ] #### `ggplot2` is the plotting package of the `tidyverse` --- ## Tidyverse Opinionated collection of **R packages** designed for data science <img src="images/tidytools.png" width="1632" style="display: block; margin: auto;" /> .footnote[[Tidyverse webpage](https://www.tidyverse.org/)] --- class: inverse, middle, center ## Live coding #1 #### `plot()` and `ggplot()` 📝 DSCI531_lesson1_livecoding1.Rmd --- .pull-left[ #### Base R syntax ```r plot(diamonds$carat, diamonds$price) ``` 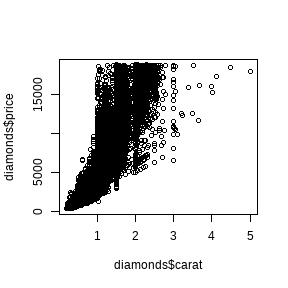<!-- --> ] .pull-right[ #### Tidyverse syntax ```r ggplot(diamonds, aes(x=carat, y=price))+ geom_point() ``` 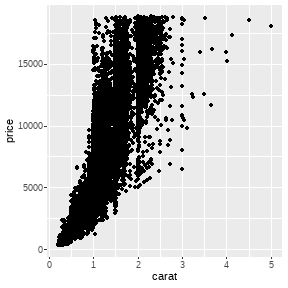<!-- --> ] --- class: middle, inverse ### The variety of R syntaxes give you **many ways to “say” the same thing** .footnote[R Syntax Comparison Cheat Sheet by Amelia McNamara] --- class: middle, center, inverse ### In this course we are going to learn `ggplot2` --- ### Why to use `ggplot2`? .pull-left[ ✔️ **Layered grammar of graphics** The syntax of the code involves only important decisions that directly impact a user’s interpretation of the data ✔️ **It is easier to get good quality plots for publication** ] .pull-right[ 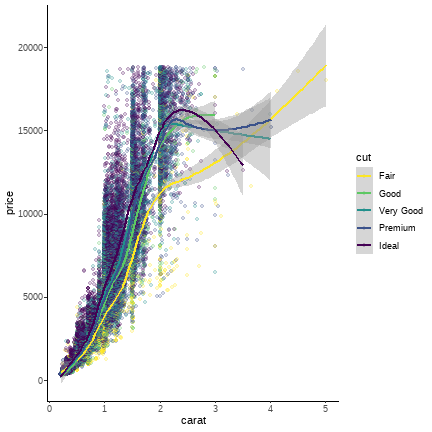<!-- --> ] .footnote[[Why I use ggplot2](http://varianceexplained.org/r/why-I-use-ggplot2/) - David Robinson] --- class: middle, center <img src="images/google.png" width="1441" style="display: block; margin: auto;" /> --- class: middle, center ## A tip for effective web searching 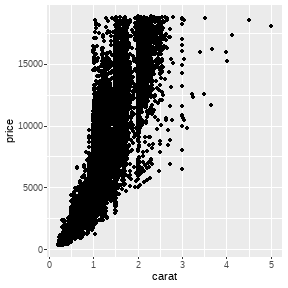<!-- --> --- #### Question <img src="images/pregunta.png" width="1299" style="display: block; margin: auto;" /> --- #### Answer 1 ❌ <img src="images/stack1.png" width="550" style="display: block; margin: auto;" /> .footnote[[Any way to make plot points in scatterplot more transparent in R?](https://stackoverflow.com/questions/12995683/any-way-to-make-plot-points-in-scatterplot-more-transparent-in-r)] --- #### Answer 2 🎉 `ggplot()` <img src="images/stack2.png" width="963" style="display: block; margin: auto;" /> .footnote[[Any way to make plot points in scatterplot more transparent in R?](https://stackoverflow.com/questions/12995683/any-way-to-make-plot-points-in-scatterplot-more-transparent-in-r)] --- class: middle, inverse, center ### Now we are ready to learn more about `ggplot2` --- background-image: url(images/cuadrados.png) background-size: cover .bg-washed-green.b--dark-green.ba.bw2.br3.shadow-5.ph4.mt5[ ### References * Wickham, H., & Grolemund, G. (2016). [R for data science: import, tidy, transform, visualize, and model data.](https://r4ds.had.co.nz/) O'Reilly Media, Inc. * Wickham, H. (2010). [A layered grammar of graphics](http://vita.had.co.nz/papers/layered-grammar.pdf). Journal of Computational and Graphical Statistics, 19(1), 3-28. * Wickham, H. (2016). [Ggplot2: Elegant graphics for data analysis.](https://ggplot2-book.org/) Springer, 2016. ] --- background-image: url(images/cuadrados.png) background-size: cover .bg-washed-green.b--dark-green.ba.bw2.br3.shadow-5.ph4.mt5[ ### Blogposts - Cheat Sheets * [R Syntax Comparison Cheat Sheet](https://www.amelia.mn/blog/teaching/2018/02/11/Syntax-comparison.html) by Amelia McNamara * [Why I use ggplot2](http://varianceexplained.org/r/why-I-use-ggplot2/) by David Robinson ] --- <img src="images/concept_map.png" width="1053" style="display: block; margin: auto;" /> .footnote[Concept Map - Data Visualization in R - Lesson 1]